Decoding the City's Pulse: Analyzing NYC 311 Data with LLMs
NYC’s 311 system generated ~3.5 million service requests in 2024, a perfect dataset for testing whether local LLMs can handle large-scale text analysis without API costs or rate limits. In this post, I’ll walk through how I used a local LLM to categorize and analyze these requests, revealing insights into the city’s pulse.
Instead of processing each request individually, I reduced the dataset to ~1,200 unique combinations of agency, complaint type, and descriptor fields, then used a local LLM to categorize these patterns. This approach works well for pre-computing categories to later use for analysis, such as identifying hotspots or trends.
Visualizing the Baseline Data
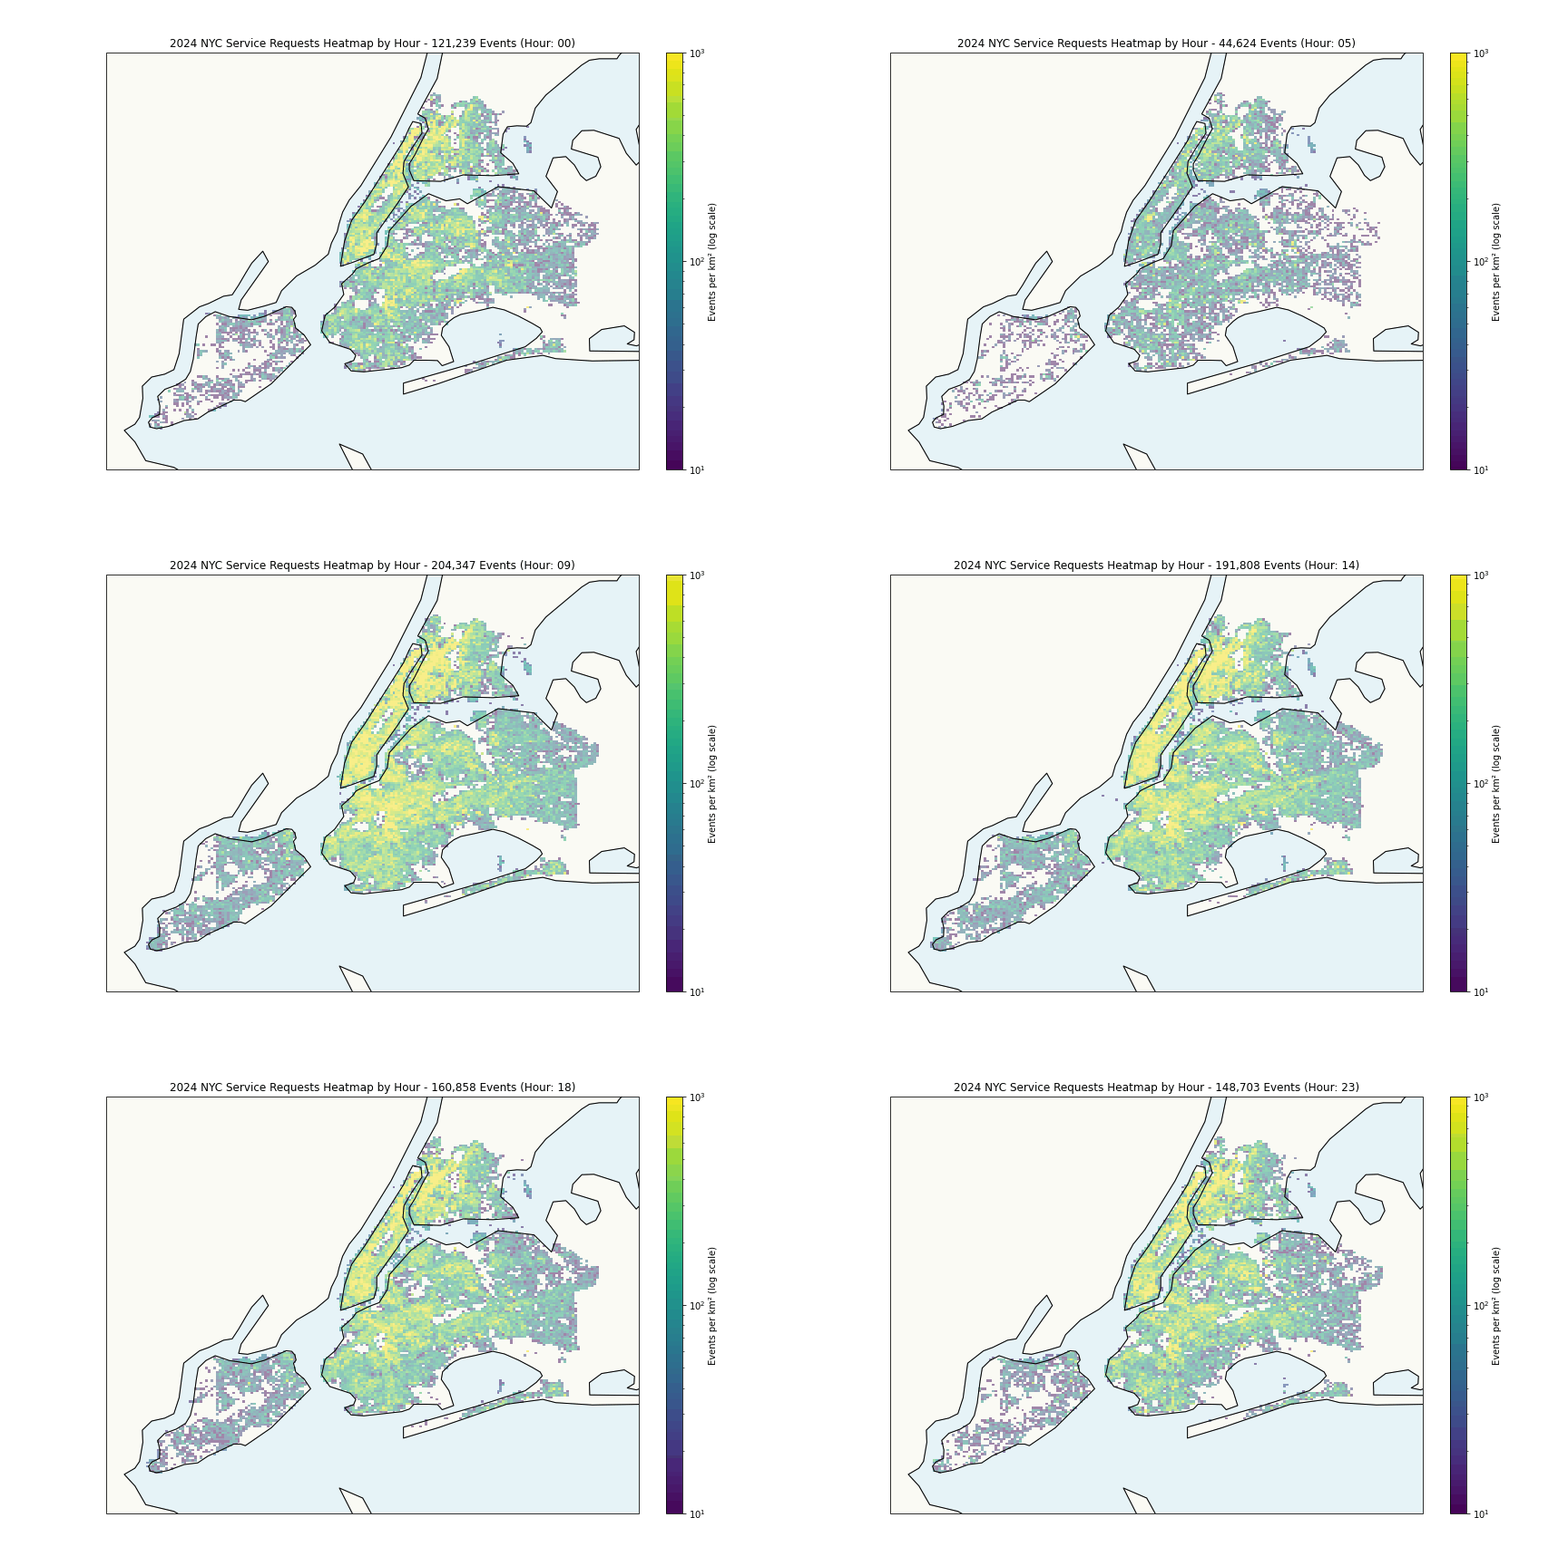
Before diving into LLM categorization, let’s examine the spatial and temporal patterns in the raw data:
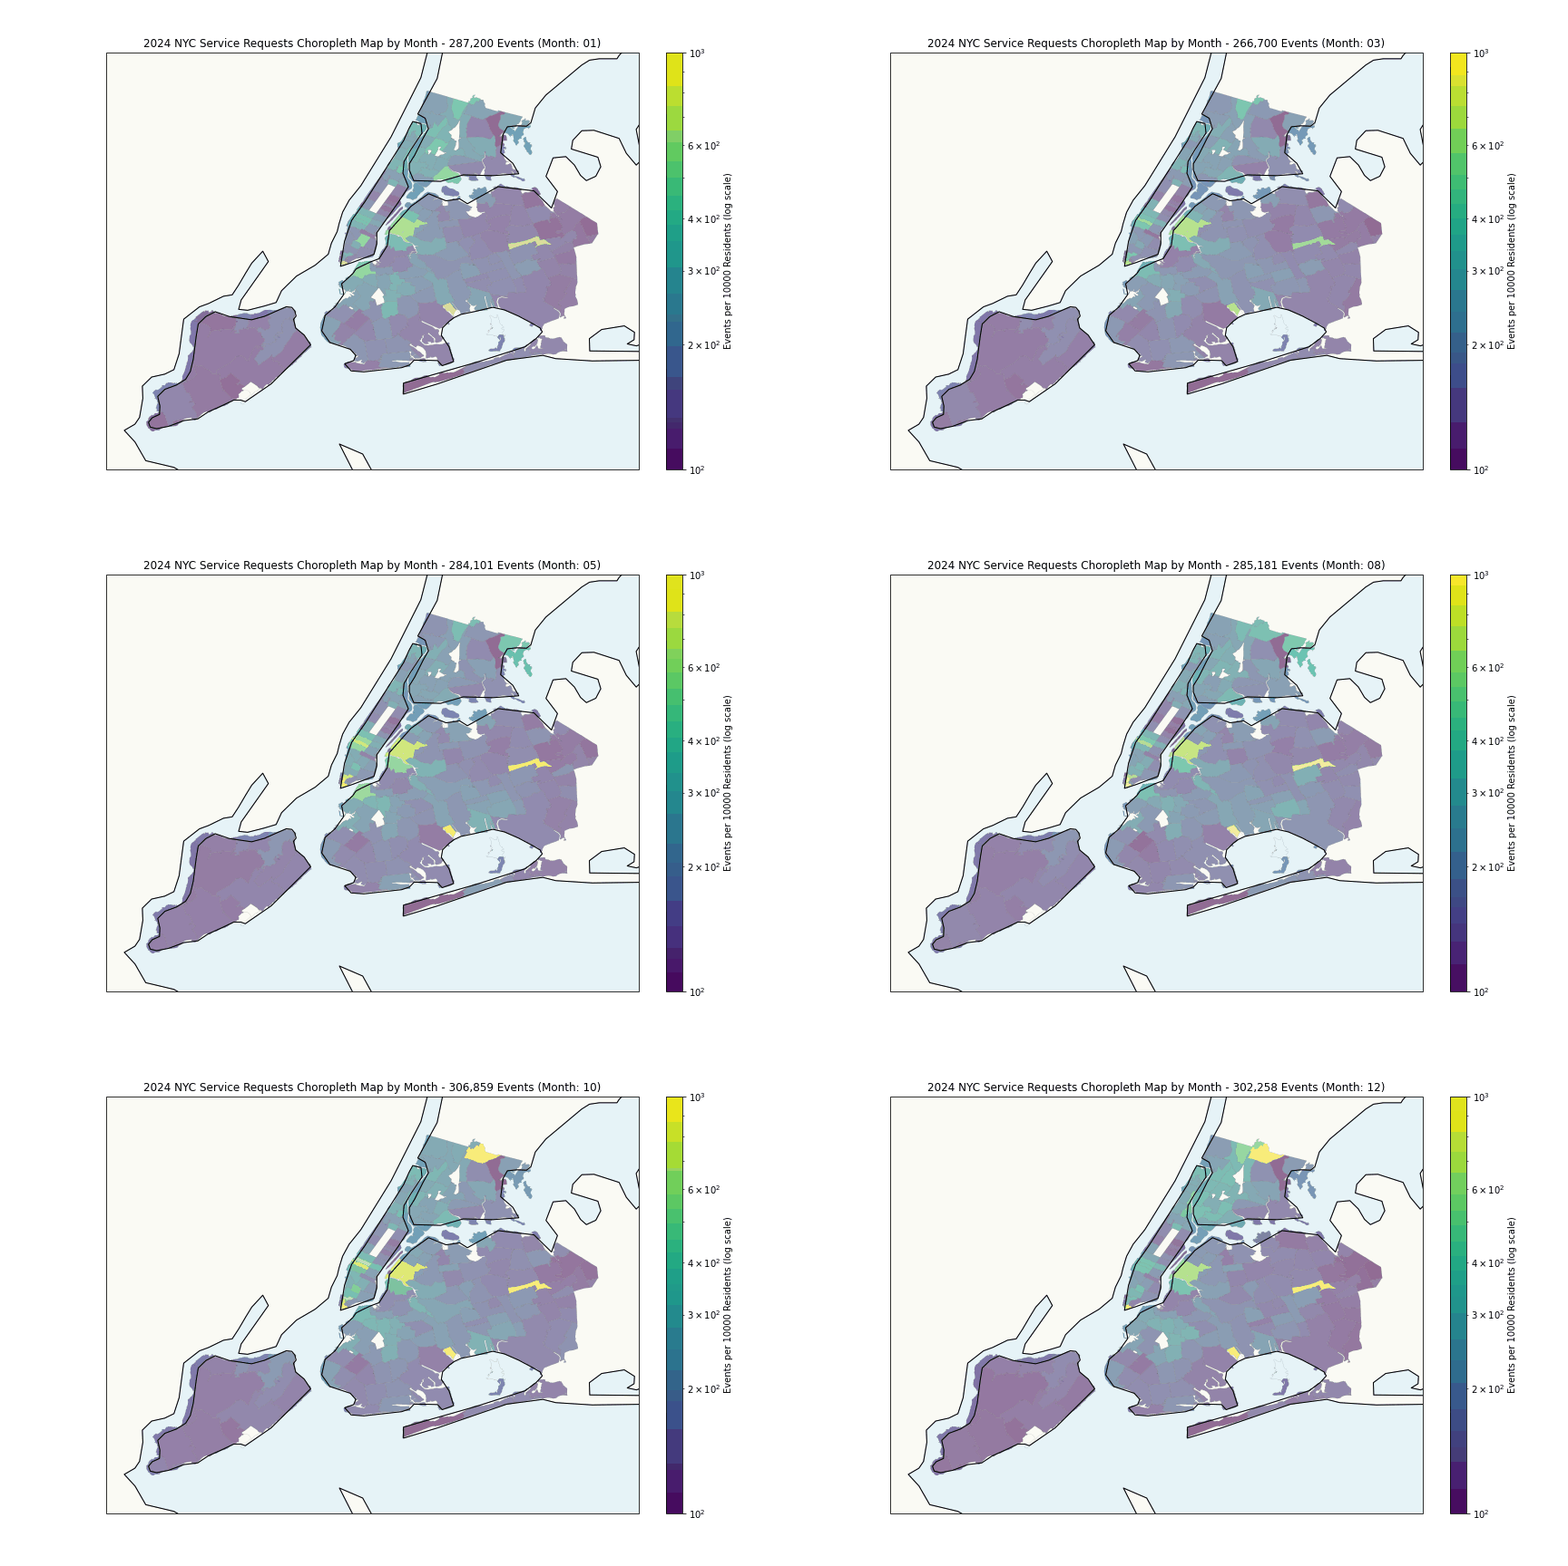
The heatmap shows expected patterns, high density correlates with population density. More interesting is the per-capita analysis:
Some hotspots with anomalously high request rates (highest month per zipcode):
| Zip Code | Neighborhood | Month | Requests per 1000 Residents |
|---|---|---|---|
| 10466 | Wakefield | Dec 2024 | 275 |
| 10004 | Financial District | Oct 2024 | 241 |
| 11239 | East New York | Dec 2024 | 166 |
| 11366 | Fresh Meadows | Jun 2024 | 158 |
| 10006 | Financial District | Jul 2024 | 109 |
| 11101 | Long Island City | Sep 2024 | 101 |
| 10018 | Garment District | Oct 2024 | 95 |
| 10007 | Tribeca | Sep 2024 | 92 |
| 10464 | City Island | Jun 2024 | 86 |
| 10036 | Hell’s Kitchen | Oct 2024 | 81 |
The Financial District’s high rates likely reflect commercial density rather than residential issues, while areas like Wakefield and East New York suggest genuine challenges.
LLM-Powered Categorization
To extract insights from this massive dataset, I integrated a local LLM directly into DuckDB using a custom User Defined Function (UDF). This approach combines SQL’s analytical power with modern language models, processing and categorizing data at scale within a single query.
DuckDB + LLM Integration
I created a Python UDF that connects DuckDB to a local install of LM Studio, serving the gemma-3-27b-it model via OpenAI-compatible API.
Here’s the core implementation:
# This file contains the UDF for calling the local LLM API.
# Register the Python function as a scalar UDF
# con.create_function("prompt", prompt, [str, str, str, float], str)

import json

import requests

MODEL = "gemma-3-27b-it"
MODEL_TEMP = 0.4
MODEL_MAX_TOKENS = -1


# Define the UDF
def prompt(
    prompt_text: str,
    system_message: str | None = None,
    json_schema: str | None = None,
    temperature: float | None = None,
) -> str:
    """
    Calls the local LLM API and returns the response.
    """
    url = "http://localhost:1234/v1/chat/completions"
    headers = {"Content-Type": "application/json"}
    payload = {
        "model": MODEL,
        "messages": [
            {"role": "user", "content": prompt_text},
        ],
        "temperature": MODEL_TEMP,
        "max_tokens": MODEL_MAX_TOKENS,
        "stream": False,
    }

    # Set system message if provided
    if system_message is not None:
        payload["messages"].insert(0, {"role": "system", "content": system_message})

    # Set temperature if provided
    if temperature is not None:
        payload["temperature"] = temperature

    if json_schema:
        payload["response_format"] = {
            "type": "json_schema",
            "json_schema": json.loads(json_schema),
        }

    try:
        response = requests.post(url, headers=headers, data=json.dumps(payload))
        response.raise_for_status()  # Raise an error for HTTP codes 4xx/5xx

        return (
            response.json()
            .get("choices", [{}])[0]
            .get("message", {})
            .get("content", "No response")
        )
    except requests.exceptions.RequestException as e:
        # Raise an exception to ensure the query fails
        raise RuntimeError(f"API request failed: {str(e)}") from e
    except Exception as e:
        # Handle any other exceptions
        raise RuntimeError(f"An error occurred: {str(e)}") from e
This UDF handles the API communication, error handling, and JSON schema enforcement. The open_prompt DuckDB extension provides similar functionality, but I opted for a custom UDF to ensure I had full control over the model usage and response formatting.
SQL-Powered Categorization
The following python code snippet demonstrates how to use the UDF within a DuckDB query to categorize service requests based on agency, complaint type, and description. The LLM processes each unique combination, returning a JSON object with the assigned category and subcategory.
Load the UDF and other necessary libraries, then define the system prompt and JSON schema for the LLM:
import json

import duckdb
from jinja2 import Template

from src.duckdb_prompt_udf import prompt

# Connect to DuckDB
con = duckdb.connect(database=":memory:", read_only=False)

# Register the Python function as a scalar UDF
con.create_function("prompt", prompt, [str, str, str, float], str)
Define the system prompt and JSON schema for the LLM. The system prompt instructs the model to categorize service requests based on predefined categories and subcategories, while the JSON schema ensures valid responses:
system_prompt = (
    "You are a government auditor reviewing New York's 311 service request system.\n\n"
    "Your task:\n"
    "1. Review the given service request details (agency, complaint type, and description)\n"
    "2. Choose the most appropriate category and subcategory from the provided CATEGORIES json structure\n"
    "3. The sample data in CATEGORIES json serves as guidance for classification\n\n"
    "Important rules:\n"
    "- Only use CATEGORIES and SUBCATEGORIES that exist in the provided CATEGORIES json block\n"
    "- Do NOT use the sample labels as categories or subcategories\n"
    "- Do NOT create new categories\n\n"
    "Response format:\n"
    "```json\n"
    '{"category": "STRING", "subcategory": "STRING"}\n'
    "```\n"
    "Note: Your response must contain ONLY the JSON object, nothing else."
)

#  Define the JSON schema for the response
json_schema = json.dumps(
    {
        "name": "category_response",
        "type": "object",
        "strict": "true",
        "schema": {
            "type": "object",
            "properties": {
                "category": {
                    "type": "string",
                },
                "subcategory": {
                    "type": "string",
                },
            },
        },
        "required": ["category", "subcategory"],
    }
)
Finally, we define the SQL query that uses the UDF to categorize service requests. The query processes the dataset, calling the LLM for each unique combination of agency, complaint type, and descriptor. The prompt function formats the request, while the JSON schema ensures valid responses.
# Define the SQL query template
query_template = """
COPY (
    WITH llm_categorization AS (
        SELECT
            regexp_replace(
                prompt(
                    '# CATEGORIES:\n'
                    || '```json\n'
                    ||categories::VARCHAR || '\n'
                    || '```\n'
                    ||'# SERVICE REQUEST:\n'
                    ||'AGENCY: ' || IFNULL(agency, 'N/A') || '\n'
                    ||'COMPLAINT TYPE: ' || IFNULL(complaint_type, 'N/A')  || '\n'
                    ||'DESCRIPTION: ' || IFNULL(descriptor, 'N/A') || '\n',
                    ''::VARCHAR,
                    ''::VARCHAR,
                    ::FLOAT
                ),
                '```json|```',
                '',
                'g'
            )::VARCHAR AS raw_llm_response,
            json_extract_string(raw_llm_response, '$.category')::VARCHAR AS category,
            json_extract_string(raw_llm_response, '$.subcategory')::VARCHAR AS subcategory,
            agency,
            complaint_type,
            descriptor,
            request_count,
        FROM (
            SELECT
                agency,
                complaint_type,
                descriptor,
                count(*) AS request_count
            FROM ""
                group by 1,2,3
                order by 4 desc
                limit
        ) CROSS JOIN read_json('./data/categories.json')
    )

    SELECT
        agency,
        complaint_type,
        descriptor,
        category,
        subcategory,
        raw_llm_response,
        request_count
    FROM llm_categorization
) TO '';
"""

# # Render the template with variables
template = Template(query_template)
query = template.render(
    system_prompt=system_prompt,
    json_schema=json_schema,
    temperature=0.2,
    data_file="./data/cityofnewyork/service_requests_2024.parquet",
    output_file="./output/llm_categorize_output_2024.csv",
    limit=1200,
)

# Execute the query
print("Executing query...")

result = con.execute(query).fetchall()
print(result)
The input dataset is a Parquet file containing NYC 311 service requests for 2024, which is read into DuckDB. The query deduplicates the dataset to focus on unique combinations of agency, complaint type, and descriptor, significantly reducing the number of LLM calls required.
The categories.json file contains the predefined categories and subcategories, which the LLM uses to classify requests. The query deduplicates the dataset, reducing it from 3.5 million records to just ~1,200 unique combinations.
The resulting categorized data is saved to a CSV file, which can be used for further analysis, by loading it back into DuckDB or any other data analysis tool.
Processing Results
Processing this SQL query with the LLM integration took about 60 minutes on a MacBook Pro. Each LLM call took 2-4 seconds, with the bottleneck being model inference rather than data processing.
The model achieved high categorization accuracy. I manually reviewed a random sample of 200 requests and found ~196 correctly assigned. This 98% figure should be taken as indicative rather than rigorous.
Breaking down the data
Now that we have the data categorized, we can start to break it down by category and subcategory to identify trends.
The top 10 request categories/subcategories for 2024 are:
| Category | Subcategory | Request Count |
|---|---|---|
| Public Safety & Order | Parking | 796,805 |
| Public Safety & Order | Noise & Disturbances | 752,910 |
| Housing & Infrastructure | Building & Utilities | 715,222 |
| Environmental Health & Sanitation | Waste Management & Sanitation | 247,084 |
| Housing & Infrastructure | Street & Sidewalk Conditions | 234,890 |
| Environmental Health & Sanitation | Animals & Pests | 129,931 |
| Hazardous Conditions | Water Quality & Leaks | 113,746 |
| Government & Community Services | Parks & Community | 104,311 |
| Public Safety & Order | Non-Emergency Police Matters | 95,088 |
| Consumer & Business Services | Consumer Complaints | 64,080 |
These results align well with the primary functions of NYC’s 311 system, showing that our LLM-powered categorization has successfully identified the most common types of citizen requests across the city.
Conclusion
This analysis demonstrates how LLMs can automatically categorize large-scale government datasets at zero marginal cost. By integrating a local LLM into DuckDB through a custom UDF, we processed 3.5 million NYC 311 requests with 98% accuracy in 60 minutes on consumer hardware.
The key technical insight—deduplication before processing—reduced computational requirements by 99.97% while maintaining analytical value. This approach proves that sophisticated text analysis can be performed cost-effectively without relying on expensive cloud APIs.
Performance characteristics:
- Input: 3.5M records → 1,200 unique combinations
- Processing: 60 minutes on M4 Max MacBook Pro with 36GB RAM
- Accuracy: 98% on manual validation sample
- Cost: $0
The complete methodology could be applied to any large-scale text classification task where deduplication is possible, or sufficiently unique combinations exist. This opens up new possibilities for real-time categorization of citizen requests, customer feedback, and other large text datasets.
What’s Next?
Having established a working methodology for LLM-powered categorization of NYC 311 data, several analytical directions could provide deeper insights:
Seasonal Patterns: Analyze how complaint categories vary throughout the year—do heating complaints surge in winter while noise complaints peak in summer?
Neighborhood Clustering: Combine our categorized data with the geographic hotspots to identify which neighborhoods consistently report specific types of issues.
Response Time Analysis: Use LLMs to extract urgency indicators from complaint text and correlate with actual resolution times across different categories.
Predictive Modeling: Train machine learning models on the categorized data to predict future complaint trends based on historical patterns.
The complete code is available in the markusos/llm_duck repository.

